
Amazon closed 2025 with $716.9 billion in net sales, up 12% year over year, and third-party sellers accounted for 61% of paid units sold in Q4 2025 — the highest share on record. Behind that headline sits a market that is simultaneously bigger, more competitive, and more concentrated than at any point in Amazon's history: active seller counts are falling, average CPCs are climbing, and revenue is consolidating into a shrinking pool of top performers. This is the 2026 data set every seller, agency, and investor needs to make decisions from — not estimates, not anecdotes, but sourced numbers.
Every statistic below is dated and attributed to a named source. Where a figure is a range rather than a single number, that is because the underlying research reports it as a range — we have not manufactured false precision. This page is maintained as a living resource and will be updated as new quarterly and annual data is published.
Reading these numbers together rather than in isolation matters. A rising GMV figure alongside a falling active-seller count is not two unrelated data points — it is the single clearest signal available that Amazon's marketplace economics have shifted from broad-based growth toward winner-concentrated growth. Every section below is organized so you can see both the headline figure and the surrounding context needed to interpret it correctly, because a statistic reported without its source, date, and surrounding market context is close to useless for actual decision-making.
Amazon Marketplace Statistics 2026
- Amazon's full-year 2025 net sales reached $716.9 billion, up 12% year over year. Source: Amazon 2025 Annual Report.
- Third-party sellers accounted for 61% of paid units sold on Amazon in Q4 2025. Source: Amazon Q4 2025 shareholder letter, via Marketplace Pulse.
- Third-party seller services revenue reached $184.1 billion for full-year 2025, with Q4 2025 alone contributing $48.8 billion (up 13% year over year). Source: Amazon 2025 Annual Report.
- Third-party marketplace GMV grew 15% year over year, from roughly $500B in 2024 to an estimated $575B in 2025 — about 69% of total Amazon GMV. Source: Marketplace Pulse, 2025 analysis.
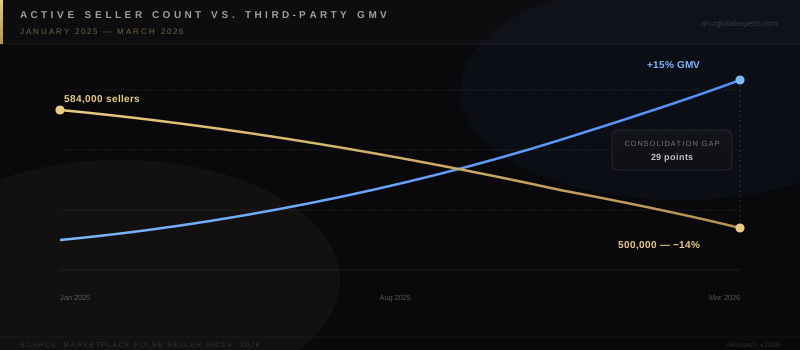
- Active seller count on Amazon.com fell from 584,000 in January 2025 to 500,000 in March 2026. Source: Marketplace Pulse Seller Index, 2026.
- Amazon registered 165,000 new sellers in 2025 — the lowest annual figure since Marketplace Pulse began tracking new-seller registration in 2015. Source: Marketplace Pulse, 2026.
- Fewer than 8,000 sellers now generate half of Amazon's estimated $300 billion in U.S. third-party GMV, down from roughly 15,000 sellers holding that position less than three years earlier — a sharp acceleration in revenue concentration. Source: Marketplace Pulse, 2026.
- U.S. sellers averaged more than $375,000 in annual sales in 2025. Source: Jungle Scout, State of the Amazon Seller 2026.
- A record 75,000+ independent sellers each crossed $1 million in sales in 2025 — a 36% jump over 2024. Source: Jungle Scout, State of the Amazon Seller 2026.
- Only 6% of sellers have crossed $1,000,000 in lifetime sales; 47% remain under $25,000 lifetime. Source: Jungle Scout, State of the Amazon Seller 2026.
- Jungle Scout's 2026 survey covered more than 1,500 sellers globally, with 36% identifying as brand owners and 42% as ecommerce professionals. Source: Jungle Scout, State of the Amazon Seller 2026.
- 26% of sellers have only one product listed; 77% have fewer than 10 products listed. Source: Jungle Scout Seller Survey, 2025.
The consolidation trend visible in the marketplace-level numbers repeats itself inside the seller-performance data. A $375,000 average annual sales figure sitting alongside a 47%-under-$25,000 figure is not a contradiction — it is exactly what a right-skewed, winner-concentrated distribution looks like. The "average seller" implied by that mean figure does not really exist; there is a large base of small or stalled sellers and a much smaller cohort of sellers generating the revenue that pulls the average upward. Any seller benchmarking themselves against the $375,000 average figure without accounting for this skew is very likely comparing themselves to the wrong reference point.
FBA & Fulfilment Statistics
- Among sellers using FBA, FBM, or both, 64% ship exclusively through FBA, though overall FBA usage dipped 3% year over year. Source: Jungle Scout, State of the Amazon Seller 2026.
- 22% of sellers run a hybrid FBA/FBM fulfilment model. Source: Jungle Scout, State of the Amazon Seller 2026.
- Amazon's confirmed 2026 FBA fee increase averages $0.08 per unit, with no new fee types introduced. Source: Amazon Seller Central fee update, 2026, via AMZ Prep.
- Standard-size monthly storage rates rose to $0.87 per cubic foot (Jan–Sep) and $2.40 per cubic foot (Oct–Dec) for 2026, up from $0.76 and $2.10 respectively. Source: Amazon FBA fee schedule, 2026.
- Amazon restructured 2026 aged-inventory surcharge thresholds, adding a new 15-month tier, with surcharges now beginning at the 12-month mark. Source: Amazon Seller Central, 2026 fee update.
- AWD West Region storage costs rose to $0.57 per cubic foot per month, a 19% increase. Source: Amazon FBA fee schedule, 2026.
- 22% of sellers report reaching profitability within their first three months. Source: Jungle Scout, State of the Amazon Seller 2026.
- Many Amazon FBA sellers continue to report profit margins above 15% in 2026 despite fee increases. Source: Jungle Scout, State of the Amazon Seller 2026.
- Across a global multi-marketplace seller sample, roughly 73% of active sellers use FBA as their primary fulfilment method versus 27% primarily FBM. Source: Accio, Top Seller Countries on Amazon, 2026.
- 86% of top-performing sellers by revenue use FBA — notably higher than the 73% FBA rate across the full seller base, suggesting fulfilment method correlates with seller success. Source: NovaData, Amazon Seller Statistics 2026.
The fee data tells a related story about where margin pressure is actually concentrated. An $0.08-per-unit average fee increase sounds negligible in isolation, but it arrives stacked on top of the Q4 storage-rate jump to $2.40 per cubic foot and a restructured aged-inventory surcharge schedule that now triggers a full three months earlier than before at the 12-month mark. For sellers carrying slower-moving inventory into peak season, the combined effect of these three changes compounds in a way that a single average-fee-increase headline understates significantly.
Seller Growth & Competition Statistics
Key Finding: Active seller count fell 14% between January 2025 and March 2026 while third-party GMV grew 15% over roughly the same period. The Amazon marketplace is not shrinking — it is consolidating, with fewer sellers controlling a larger and growing share of total sales.
This consolidation pattern is not new to 2026 — it has been building for several years — but the rate of acceleration is what distinguishes the current data from prior periods. The shift from roughly 15,000 sellers controlling half of third-party GMV to fewer than 8,000 sellers holding that same position happened over less than three years, a compression rate that outpaces the underlying GMV growth rate itself. That gap between GMV growth and seller-count growth is the single most important number in this entire dataset for anyone evaluating whether to enter, exit, or double down on Amazon as a channel in 2026.
- Sub-8,000 sellers now generate half of Amazon's estimated $300B U.S. third-party GMV — down from ~15,000 sellers three years earlier. Source: Marketplace Pulse, 2026.
- New seller registrations dropped to 165,000 in 2025, the lowest since 2015 and down 44% from a peak of over 295,000 in 2020. Source: Marketplace Pulse, 2026, via NovaData compilation.
- Historic third-party unit share on Amazon has climbed from roughly 30% in the mid-2000s to 61% in Q4 2025. Source: Marketplace Pulse, "Amazon Percent of Units by Third-Party Sellers," 2004–2026 dataset.
- The majority of Amazon sellers — 64% — are small businesses earning under $100,000 per year in revenue. Source: NovaData, Amazon Seller Statistics 2026.
- Only 3% of sellers reach seven-figure annual revenue. Source: NovaData, Amazon Seller Statistics 2026.
- Roughly 65% of Amazon sellers report being profitable, with the typical seller generating $10,000–$25,000 in monthly revenue. Source: NovaData, Amazon Seller Statistics 2026.
- The top 1% of sellers capture more than 27% of total marketplace revenue — a concentration figure consistent with the sub-8,000-sellers-hold-half-of-GMV finding above. Source: NovaData, Amazon Seller Statistics 2026.
- Nearly half of Amazon sellers — 44% — diversify by also operating a direct-to-consumer store rather than relying on Amazon exclusively. Source: NovaData, Amazon Seller Statistics 2026.
Amazon Seller Demographics & Geography
Marketplace-level statistics describe Amazon's overall scale, but they say little about who is actually selling and from where. A January–February 2026 storefront-level dataset covering the USA, UK, and France marketplaces — the largest publicly analyzed sample of its kind — makes the geographic and origin picture far more concrete.
- Amazon's global marketplace network has 9.7 million total registered sellers, of which approximately 1.9 million actively sell across Amazon's worldwide storefronts. Source: NovaData, Amazon Seller Statistics 2026.
- Amazon operates dedicated, country-specific marketplaces in 21 countries, spanning North America, Europe, the Middle East, Asia, and Latin America. Source: NovaData, Amazon Seller Statistics 2026.
- A January–February 2026 analysis of 67,416 active seller storefronts found the USA marketplace holding 38,088 storefronts (56.5%), the UK 21,920 (32.5%), and France 7,247 (10.7%). Source: The Seller Index, State of Amazon Sellers 2026.
- China-based sellers operate 69.7% of storefronts in that dataset (46,983 of 67,416) — by far the largest single seller-origin group across all three marketplaces analyzed. Source: The Seller Index, State of Amazon Sellers 2026.
- USA-based sellers account for 11.7% of storefronts (7,886), UK-based sellers 9.4% (6,325), and Hong Kong-based sellers 3.1% (2,120). Source: The Seller Index, State of Amazon Sellers 2026.
- China-origin concentration varies by marketplace: 72.1% in the USA storefront base, 67.2% in the UK, and 65.7% in France. Source: The Seller Index, State of Amazon Sellers 2026.
- Chinese-origin sellers comprise more than 40% of Amazon's top-performing seller base by revenue, concentrated particularly in electronics, home goods, and accessories. Source: NovaData, Amazon Seller Statistics 2026.
- Half of Amazon's top-performing sellers by revenue operate from the United States. Source: NovaData, Amazon Seller Statistics 2026.
- Average storefront rating varies by marketplace: 4.68 in the USA, 4.57 in the UK, and 4.56 in France, with Hong Kong-origin storefronts posting the highest average at 4.82. Source: The Seller Index, State of Amazon Sellers 2026.
- 93.5% of storefronts in the dataset carry verified customer ratings, with an average of roughly 4 listed products per storefront. Source: The Seller Index, State of Amazon Sellers 2026.
- US-origin sellers average 305 reviews per storefront, versus just 98 reviews per storefront for China-origin sellers — a review-density gap of more than 3×. Source: The Seller Index, State of Amazon Sellers 2026.
Category Breakdown Statistics
Home & Kitchen, Electronics, and DIY & Tools together account for 38.7% of all analyzed storefronts — the top-heavy category concentration mirrors the seller-revenue concentration documented above.
| Category | Sellers (Storefronts) |
|---|---|
| Home & Kitchen | 10,215 |
| Electronics & Photo | 8,587 |
| DIY & Tools | 7,000 |
| Beauty | 5,364 |
| Automotive | 3,678 |
| Tools & Home Improvement | 3,598 |
| Sports & Outdoors | 3,419 |
| Computers & Accessories | 3,018 |
| Grocery & Gourmet Food | 2,990 |
| Health & Household | 2,627 |
| Toys & Games | 2,465 |
| Office Products | 2,275 |
| Pet Supplies | 2,146 |
| Baby Products | 2,086 |
| Garden & Outdoors | 1,002 |
Source: The Seller Index, State of Amazon Sellers 2026 (top 15 categories by storefront count, Jan–Feb 2026 dataset).
Global Ecommerce Market Statistics
- Global retail ecommerce sales are forecast at approximately $6.88 trillion in 2026, up from roughly $6.42 trillion in 2025. Source: EMARKETER 2026 forecast, via Shopify.
- Ecommerce is projected to account for 21.1% of worldwide retail sales in 2026. Source: EMARKETER, 2026.
- U.S. ecommerce sales reached 16.4% of total U.S. retail sales for full-year 2025, rising to 16.9% in Q1 2026. Source: U.S. Census Bureau, Quarterly Retail E-Commerce Sales Report, Q1 2026.
- Total U.S. ecommerce sales for 2025 were estimated at $1,233.7 billion, a 5.4% increase over 2024, while total retail sales grew only 3.5% over the same period — ecommerce continues to outgrow retail overall. Source: U.S. Census Bureau, 2025 Annual Retail Trade Report.
- Q1 2026 U.S. ecommerce sales grew 9.8% year over year, more than double the 3.9% growth rate of total retail sales in the same quarter. Source: U.S. Census Bureau, Q1 2026 release.
- Amazon accounts for an estimated 37.6% of total U.S. ecommerce sales, and Amazon's share of global online retail sales remains above 35%. Source: Accio, Amazon Sales by Country Trend, 2026.
- Amazon's advertising revenue reached an estimated $68.6 billion in 2025, up 22% year over year. Source: NovaData compilation of Amazon financial disclosures, 2026.
What Wikipedia and Historical Data Reveal
Amazon Marketplace launched in 2000 as a third-party listing feature bolted onto Amazon's first-party retail catalogue. For most of the 2000s, third-party units represented a minority of total sales. That balance inverted permanently in the 2010s, and by Q4 2025 third-party sellers accounted for 61% of all units sold — a structural majority that has held and grown for several consecutive years. The historical trajectory documented by Marketplace Pulse's "Percent of Units by Third-Party Sellers" tracking (2004–2026) shows this as a steady, near-monotonic climb rather than a recent spike, which is the single clearest piece of evidence that Amazon's own growth strategy has depended on third-party sellers, not competed against them.
International Selling & Cross-Border Statistics
- Fewer than 15% of Amazon sellers operate in more than one marketplace, per longstanding Marketplace Pulse tracking — a figure that has been broadly stable across recent years even as domestic competition intensifies, which is one reason our Amazon Europe & Middle East expansion playbook treats international expansion as a genuine competitive advantage rather than a checkbox.
- Global ecommerce growing to a projected $6.88 trillion in 2026 means cross-border-capable sellers are addressing a materially larger opportunity than the U.S. marketplace alone represents. Source: EMARKETER, 2026.
- The UK runs the highest ecommerce penetration among major Western markets at 27.3% of total retail, with UK online retail forecast at £163–168 billion for 2026 — well ahead of the US at 16.9% and Australia at 12.7%. Source: Eightx, Ecommerce Penetration US/UK/EU/AU/Canada 2026.
- Germany generated an estimated $89.71 billion in ecommerce sales, ranking as Europe's second-largest market behind the UK, with penetration in the mid-range 15–25% band. Source: SaleHoo, Ecommerce Market Size by Country, 2026.
- Canada's ecommerce penetration sits at just 5.7% of total retail — the lowest among major English-speaking markets and a signal of meaningful headroom for sellers expanding there. Source: Eightx, Ecommerce Penetration US/UK/EU/AU/Canada 2026.
- Amazon's UK storefront base alone — 21,920 active sellers in the Jan–Feb 2026 dataset — is nearly 60% the size of the entire US storefront base, underscoring how concentrated the opportunity already is outside the United States. Source: The Seller Index, State of Amazon Sellers 2026.
Amazon Advertising & PPC Statistics
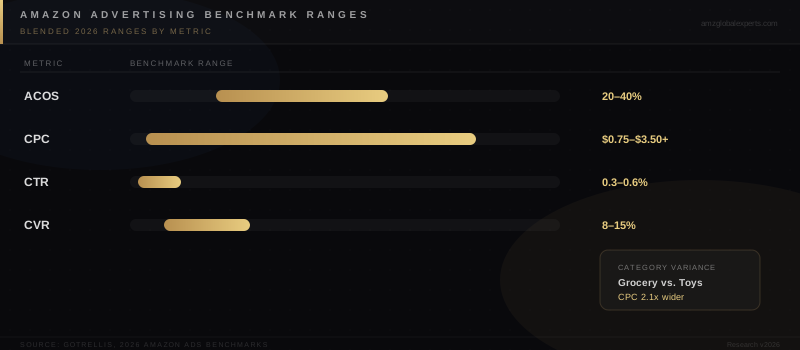
- Average Amazon CPC across categories sits around $1.04–$1.13 in 2025–2026, with one 2026 aggregate reporting CPC rising 15.5% to $1.12. Source: Ad Badger, 2025–2026 Amazon Advertising Benchmarks.
- Platform-average ACOS sat near 25–30% in 2025 and is projected to rise to 32–35% in 2026 as CPCs continue climbing. Source: Ad Badger, 2026 Amazon Advertising Benchmarks.
- A separate 2026 benchmark pegs the average account at roughly 34% ACoS, $1.13 CPC, 0.56% CTR, and a 10.5% conversion rate, with "healthy" accounts running 30–32% ACoS, $1.18–$1.22 CPC, 0.4–0.6% CTR, and 10–12% CVR. Source: GoTrellis, Amazon Ads Benchmarks by Category and Ad Type, 2026.
- A 38-account blended-data study reported a median ACOS of 38% (middle 50% range: 25–53%), median CPC of $1.07, median conversion rate of 8.3% of clicks converting, and median TACOS of 15% (middle 50% range: 10–21%). Source: SellerPlex, Amazon PPC Benchmarks 2026.
- Sponsored Products typically runs 0.3–0.7% CTR, 10–18% CVR, and 15–25% ACoS; Sponsored Brands runs 0.4–0.9% CTR and 20–35% ACoS; Sponsored Display runs 0.2–0.5% CTR and 25–40% ACoS. Source: GoTrellis, 2026 Amazon Ads Benchmarks.
- Food & Grocery produces the lowest average ACOS at roughly 23%, driven by high repeat-purchase rates and low CPCs (~$0.56). Source: GoTrellis / Autron, 2026 category benchmark analysis.
- Toys & Games runs among the lowest average CPC of any category at roughly $0.70, while Beauty and Grocery run $1.20–$1.50 — more than double, reflecting higher competitive bidding in those categories. Source: GoTrellis, Amazon Ads Benchmarks by Category and Ad Type, 2026.
- Amazon's advertising business grew ad revenue 22% year over year in 2025, meaningfully outpacing the company's 12% overall net sales growth — advertising is growing roughly twice as fast as the core business. Source: NovaData compilation of Amazon financial disclosures, 2026, compared against Amazon 2025 Annual Report.
Consumer Behaviour Statistics
- 92% of businesses across ecommerce now require a minimum 4-star average rating to remain competitive in 2026 buyer consideration sets. Source: WiserNotify, 2026 Review Statistics.
- The share of consumers who will only purchase from a business rated 4.5+ stars nearly doubled to 31%, up from 17% in 2025. Source: ReplyOnTheFly, 2026 Review Benchmarks.
- Most competitive product categories now require an average star rating between 4.5 and 4.7 to be genuinely competitive for the buy box and organic placement. Source: Feedback Guru, 2026 Industry Review Benchmarks.
- The Amazon Buy Box (Featured Offer) drives an estimated 80–83% of all Amazon sales, making Buy Box eligibility one of the single highest-leverage factors in seller revenue. Source: GoAura / ChannelEngine, 2026 Buy Box analysis.
- On listings with 2–3 competing sellers, a Buy Box win rate above 70–80% is considered strong; on highly competitive ASINs with 10+ sellers, a win rate of just 30–50% can still be healthy. Source: Repricer.com / SalesDuo, 2026 Buy Box benchmarks.
- Reviews generated through Amazon's Vine programme drive 34% higher conversion rates than standard organic reviews, with Amazon reporting an average 30% sales lift for products launched using Vine. Source: NovaData / ATTN Agency Vine programme analysis, 2026.
- 2026 Vine enrolment pricing spans three tiers — $200 quarterly (Basic), $500 quarterly (Professional), and $1,000+ quarterly (Advanced, with custom reviewer targeting). Source: Titannetwork, Amazon Vine Program 2026 Guide.
- A typical Vine enrolment of 30 units yields 18–26 reviews, roughly 5–10× more than the 5–10 organic reviews a product would typically generate in the same window without Vine. Source: EcomCircles / NovaData, Amazon Vine Program 2026.
- Amazon last disclosed an exact global Prime figure in April 2021, when it confirmed surpassing 200 million paid members; Amazon's public filings since 2022 report only "continued growth in Prime" without a precise count. Source: Amazon investor disclosures, cited via Redstag Fulfillment, 2026.
- Independent analyst estimates (Statista, CIRP, and others) place global Prime membership between 220 and 250 million paying members as of early 2026, generating an estimated $49.6 billion in subscription revenue in 2025. Source: Redstag Fulfillment / Backlinko Prime statistics compilation, 2026 — analyst estimate, not an Amazon-confirmed figure.
- U.S.-only Prime membership is separately estimated at roughly 180 million. Source: Redstag Fulfillment, 2026 — analyst estimate.
Amazon Operations & Workforce Statistics
- Amazon employed 1,576,000 full-time and part-time workers worldwide as of December 31, 2025, with approximately 1.1 million (70%) based in the United States. Source: Amazon 10-K filing, via AMZ Prep / Redstag Fulfillment compilation, 2026.
- Roughly 65% of Amazon's global workforce — about 1 million people — work in operations and fulfilment roles: warehouse associates, delivery drivers, and logistics coordinators. Source: AMZ Prep, 2026 workforce analysis.
- Amazon operated approximately 1,200 logistics facilities in 2025, including roughly 350 fulfilment centres globally and over 600 active logistics sites in the U.S. alone. Source: AMZ Prep / On the Seams facility analysis, 2025–2026.
- Amazon allocated $15 billion to open 80 new logistics facilities across 2025–2026, alongside a target of 100,000+ new jobs from rural delivery expansion by the end of 2026. Source: AMZ Prep, 2026 expansion analysis.
- Amazon hires up to 250,000 temporary workers during the October–January peak holiday season. Source: AMZ Prep, 2026 seasonal hiring analysis.
What Real Amazon Sellers Are Saying
r/AmazonSeller seller: "Everyone quotes the same '61% of units are third-party' stat like it's good news for sellers. What it actually means for me is 61% of the units are competing against MY units for the same eyeballs. Growth for Amazon isn't automatically growth for any individual seller." — This distinction between marketplace-level growth and individual-seller growth is one of the most consistently misunderstood points in seller discussions.
r/FulfillmentByAmazon seller: "Storage fees went up again and everyone in the comments is panicking, but the real number that should worry people is the 8,000-sellers-control-half-the-GMV stat. That's not a fee story, that's a 'the middle class of Amazon sellers is disappearing' story." — Reflects a recurring 2025–2026 theme: sellers increasingly frame fee increases and market consolidation as connected pressures rather than separate issues.
r/AmazonFBA seller: "New seller registrations at a 10-year low isn't Amazon getting harder in the abstract, it's Amazon getting harder specifically for people trying to enter without capital or expertise. If you're already established, competition from brand-new sellers is actually going down." — A contrarian but data-consistent read: falling new-seller registration can be a tailwind for established operators even as headlines frame it negatively.
How AMZ Global Experts Helps
Interpreting a data set like this one is only useful if it changes what you do next. AMZ Global Experts uses exactly this class of market, advertising, and consolidation data to inform the account-level strategy for every brand we work with — from PPC campaign structure sequenced around real 2026 CPC and ACOS benchmarks, to international expansion decisions grounded in actual cross-border adoption data rather than assumption. Our complete Amazon growth strategy guide and ten proven growth levers both build directly on the market dynamics documented above.
Conclusion
The 2026 Amazon data tells a consistent story across every category: the marketplace is larger, third-party sellers are more dominant by unit share than ever, and the number of sellers capturing that growth is shrinking. Advertising costs are rising in step with competition, and consumer expectations around reviews and ratings have never been higher. None of this is a reason to avoid Amazon — it is a reason to compete on the operating discipline that separates the sub-8,000 sellers taking half the GMV from the tens of thousands treading water below $25,000 lifetime. If you want a data-grounded audit of where your brand sits against these benchmarks, book a growth strategy session with our team.
External Sources
- Amazon 2025 Annual Report & Q4 2025 Shareholder Letter — ir.aboutamazon.com
- Marketplace Pulse, Seller Index 2026 & "Percent of Units by Third-Party Sellers" — marketplacepulse.com
- Jungle Scout, State of the Amazon Seller 2026 & 2025 Seller Survey — junglescout.com
- U.S. Census Bureau, Quarterly Retail E-Commerce Sales Report, Q1 2026 & 2025 Annual Retail Trade Report — census.gov
- EMARKETER, Global Ecommerce Forecast 2026 (via Shopify)
- Ad Badger, 2025–2026 Amazon Advertising Benchmarks — adbadger.com
- GoTrellis, Amazon Ads Benchmarks by Category and Ad Type, 2026 — gotrellis.com
- SellerPlex, Amazon PPC Benchmarks 2026 — sellerplex.com
- WiserNotify & ReplyOnTheFly, 2026 Review Statistics
- Feedback Guru, 2026 Industry Review Benchmarks
- AMZ Prep, Amazon FBA Fees 2026 Guide & Workforce/Facility Analysis 2026
- NovaData, Amazon Seller Statistics 2026 — novadata.io
- The Seller Index, State of Amazon Sellers 2026 (storefront-level dataset) — thesellerindex.com
- Accio, Top Seller Countries on Amazon & Amazon Sales by Country Trend, 2026 — accio.com
- Redstag Fulfillment & Backlinko, Amazon Prime Membership Statistics 2026 (analyst estimates)
- On the Seams, Amazon Employment Numbers by Facility Type, 2025–2026
- Eightx, Ecommerce Penetration US/UK/EU/AU/Canada, 2026 — eightx.co
- SaleHoo, Ecommerce Market Size by Country, 2026 — salehoo.com
- GoAura, ChannelEngine, Repricer.com & SalesDuo, Amazon Buy Box Benchmarks, 2026
- Titannetwork & EcomCircles, Amazon Vine Program 2026 Guides
Frequently Asked Questions
Active seller count on Amazon.com stood at approximately 500,000 as of March 2026, down from 584,000 in January 2025, according to Marketplace Pulse's Seller Index. Third-party sellers as a group accounted for 61% of all paid units sold in Q4 2025.
Third-party sellers accounted for 61% of paid units sold on Amazon in Q4 2025, per Amazon's own shareholder letter. Third-party seller services revenue reached $184.1 billion for the full 2025 fiscal year.
Reported averages vary by data source and methodology: Ad Badger's 2026 benchmark projects platform-average ACOS at 32-35%, GoTrellis reports roughly 34% for the average account with 30-32% considered healthy, and SellerPlex's blended-account study found a median of 38% with a middle-50% range of 25-53%. Category, campaign maturity, and margin all affect where an individual account should sit within these ranges.
U.S. sellers averaged more than $375,000 in annual sales in 2025 per Jungle Scout's State of the Amazon Seller 2026 report, though this average is heavily skewed by top performers — the same report found 47% of sellers remain under $25,000 in lifetime sales and only 6% have crossed $1,000,000 lifetime.
The data suggests yes: Amazon registered only 165,000 new sellers in 2025, the lowest figure since Marketplace Pulse began tracking new-seller registration in 2015, while GMV continues concentrating into a shrinking pool of top sellers — fewer than 8,000 sellers now generate half of Amazon's estimated $300 billion in U.S. third-party GMV.
Global retail ecommerce sales are forecast at approximately $6.88 trillion in 2026, per EMARKETER, up from roughly $6.42 trillion in 2025, with ecommerce projected to represent 21.1% of total worldwide retail sales.